
27 Privacy and Compliance Statistics Leaders Need to Know in Q4 2026
Jump to Section
What the latest privacy incident data reveals about volume, risk, speed, third parties, and AI.
Privacy teams are moving faster than they were just a few years ago. But the job isn’t necessarily getting easier.
Incident volume is rising. Malicious activity is growing. Third-party incidents are more likely to become notifiable breaches. And even as organizations improve response times, they’re operating under increasing regulatory pressure and tighter deadlines.
RadarFirst’s 2026 Privacy Incident Management Benchmarking Report analyzed anonymized, aggregated incident data to understand what privacy teams are actually experiencing.
Here are 27 privacy and compliance statistics leaders need to know in 2026.
Privacy incident volume is still growing
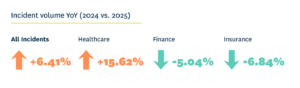
1. Overall privacy incident volume increased 6.41% year over year.
Among organizations that had been consistently using Radar Privacy for at least two years, reported incidents increased 6.41% from 2024 to 2025. Because the comparison uses a stable customer base, the increase isn’t simply the result of adding new customers.
2. Healthcare incident volume jumped 15.62%.
Healthcare experienced the largest increase among the industries analyzed, significantly outpacing the overall 6.41% increase.
3. Financial services incident volume declined 5.04%.
Finance moved in the opposite direction, with reported incident volume falling year over year.
4. Insurance incident volume declined 6.84%.
Insurance saw an even larger year-over-year decline in reported incidents. The takeaway isn’t simply that every industry is seeing more incidents. The data shows that privacy risk is evolving differently across sectors and organizations need benchmarks that reflect their own operating environment.
Privacy incidents still happen across every channel
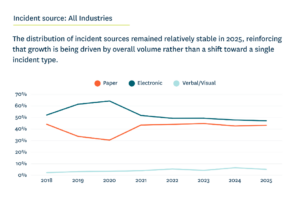
5. Electronic incidents accounted for 47.21% of total incident volume.
Electronic incidents remained the largest source category in 2025, despite dipping slightly from the prior year.
6. Paper incidents accounted for 43.25% of incidents.
Paper isn’t disappearing from the privacy risk landscape. In fact, paper-based incidents increased slightly as a share of total volume.
7. Verbal and visual incidents accounted for 5.11% of incidents.
These incidents represented a much smaller portion of overall volume.
8. Verbal and visual incident counts fell 12.9%.
That decline reversed the spike observed in the previous year. Taken together, the numbers reinforce an important operational reality: privacy incidents aren’t confined to cybersecurity events. Teams still need consistent intake and assessment processes across electronic, paper, verbal, and visual disclosures.
Third-party incidents are relatively rare but disproportionately risky
9. External incidents accounted for just 4.8% of incidents.
Third-party incidents represent a relatively small part of the overall incident landscape.
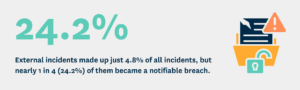
10. But 24.2% of external incidents became breaches.
Nearly one in four external incidents resulted in a breach, a significant increase from 15.9% previously.
11. The internal incident breach rate was 9.1%.
That means the overall breach rate associated with external incidents was more than 2.5 times the internal rate.
12. Healthcare’s external incident breach rate was 27.64%.
By comparison, its internal breach rate was 11.36%.
13. Finance’s external incident breach rate was 19.38%.
Its internal breach rate was only 3.45%, making the external rate almost six times higher.
14. Insurance’s external incident breach rate was 17.47%.
Its internal breach rate was just 3.03%, again, nearly a sixfold difference. For privacy and compliance leaders, third-party risk is therefore about more than frequency. A relatively small portion of incidents can account for a disproportionately serious compliance exposure.
Malicious incidents are small in number, but growing quickly
15. Malicious activity accounted for only 1.73% of reported incidents.
Most incidents were not malicious: 91% were categorized as unintentional, while another 7.3% were non-malicious.
16. Malicious incidents increased 10.3% in 2025.
That made malicious incidents the fastest-growing category by intent.
17. Overall intent-tagged incidents grew 5.3%.
Malicious incidents therefore grew at nearly twice the rate of overall intent-tagged incidents. The issue isn’t that malicious incidents dominate privacy teams’ workloads. They don’t. It’s that their growth rate is an important signal as organizations consider where their highest-consequence risks may emerge.
Most privacy incidents are surprisingly small
18. 82.71% of incidents affected just one person.
Single-person incidents made up the overwhelming majority of assessed incidents in 2025.
19. 96% of incidents involved five or fewer people.
Large breaches may attract headlines, but day-to-day privacy operations are dominated by smaller events.
20. The average number of individuals affected per incident rose from 345 to 830.
That represents a 140% increase in the average number of impacted individuals. But the report notes an important caveat: the increase was primarily driven by a small number of very large incidents rather than a broad increase in the size of the typical incident. This is exactly why averages can be misleading in privacy incident management. Teams need processes capable of handling both the steady stream of one-person incidents and the occasional event affecting thousands.
Jurisdictional complexity is changing
21. The average number of jurisdictions involved in a breach fell from 3.00 to 2.65.
Multi-jurisdictional exposure remains an important consideration, but the average decreased modestly in 2025.
22. The jurisdiction gap between breaches and non-breaches narrowed from 1.73 to 1.35.
Historically, incidents involving more jurisdictions were more clearly differentiated from non-reportable incidents. That distinction is becoming less pronounced. For compliance teams, the implication is important: jurisdiction count alone may be becoming a less useful indicator of whether an incident will ultimately trigger notification.
Privacy teams are getting faster
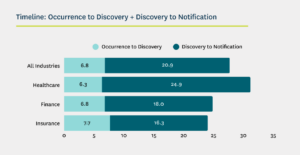
23. Average discovery-to-notification time fell to 20.9 days.
Organizations using Radar Privacy averaged 501.9 hours—or 20.9 days—from discovery to notification in 2025.
24. Discovery-to-notification time improved by 82.8 hours.
That’s approximately 3.5 days faster than the prior year. Discovery-to-assessment also improved by 63.8 hours, or roughly 2.7 days. The industry breakdown shows considerable variation: discovery-to-notification averaged 24.9 days in healthcare, 18.0 days in finance, and 16.3 days in insurance.
Notification performance is improving but gaps remain
25. Overall overdue notifications fell to 13.53%.
That represents a 3.74 percentage-point improvement from the previous year. But performance differs significantly by industry. Healthcare had an overdue rate of 11.10%, compared with 25.72% for financial services and 24.19% for insurance. The report notes that finance and insurance can face much shorter reporting windows, including deadlines as short as 72 hours, which adds execution pressure.
More incidents are requiring notification
26. 9.84% of incidents required notification.
The overall notifiable incident rate increased 1.25 percentage points from the previous year. Industry differences were substantial: healthcare had a 12.03% notifiable rate, compared with 4.17% in finance and 3.91% in insurance.
AI is adding a new dimension to privacy risk
27. AI-related privacy and security incidents increased approximately 56% year over year.
Citing the 2025 Stanford AI Index Report, the RadarFirst report highlights the rapid increase in AI-related privacy and security incidents. These events can involve automated decision-making, large-scale data ingestion, and novel attack vectors that may require different approaches to tracking, investigation, and assessment. The report also cites research finding that 82.6% of phishing emails analyzed between September 15, 2024 and February 14, 2025 contained some use of AI, illustrating how AI is becoming embedded in existing threat patterns.
What these 27 privacy statistics tell us
Taken individually, these numbers tell different stories. Together, they point toward one broader shift.
Privacy incident management is becoming an uphill sprint: teams are moving faster, but the stakes are getting higher.
Organizations have made measurable progress. Notification times are down. Overdue notifications are declining. Processes are becoming more efficient.
At the same time, incident volume keeps growing. External incidents are disproportionately likely to become breaches. Malicious activity is accelerating. And AI is introducing new sources of operational and privacy risk.
That changes what maturity looks like.
The goal can’t simply be to close incidents faster. Privacy and compliance teams increasingly need to be able to demonstrate how and why a decision was made consistently, repeatably, and based on the information available at the time.
Modern privacy programs need repeatable workflows, standardized intake and classification, documented decisions, centralized ownership, and processes that can scale as incident volume and complexity change.
Want to see the complete data?
Download the 2026 Privacy Incident Management Benchmarking Report for a deeper look at incident volume, breach complexity, notification performance, industry benchmarks, and the emerging impact of AI on privacy operations.
Related Posts
Insights on Privacy, AI Risk, and Compliance

Let’s Get Started
Trusted by leading organizations, RadarFirst enables teams to manage incidents with speed, consistency, and defensibility by standardizing how incidents are captured, assessed, and actioned.
