
- The key to improving your privacy program
- Making the case for increased funding, resources, and awareness
- Actionable KPIs to improve incident response
Read more below.
We’re all aware of the cross-industry mantra about privacy incidents and data breaches: it’s not a question of whether it will happen, but when. In fact, there were 467 confirmed data breaches across the financial and insurance industries, according to Verizon’s 2021 Data Breach Investigations Report.
As the number and impact of breaches are expected to rise in years to come, stringent data protection compliance — including compliance obligations with data breach notification laws in every U.S. state and the Gramm-Leach-Bliley Act (GLBA) — and protecting an enormous amount of sensitive customer data are top priorities for insurance organizations.
With so much sensitive information to manage — personally identifiable information (PII), bank account numbers, healthcare providers, employment information, mortgage, and vehicle information, to mention a few — it’s no wonder that risks in this industry are high.
“Mayhem is everywhere,” the slogan for a major insurance ad campaign applies across all industries, but with risks and vulnerabilities especially high in insurance, it’s important to prioritize privacy incident mitigation.
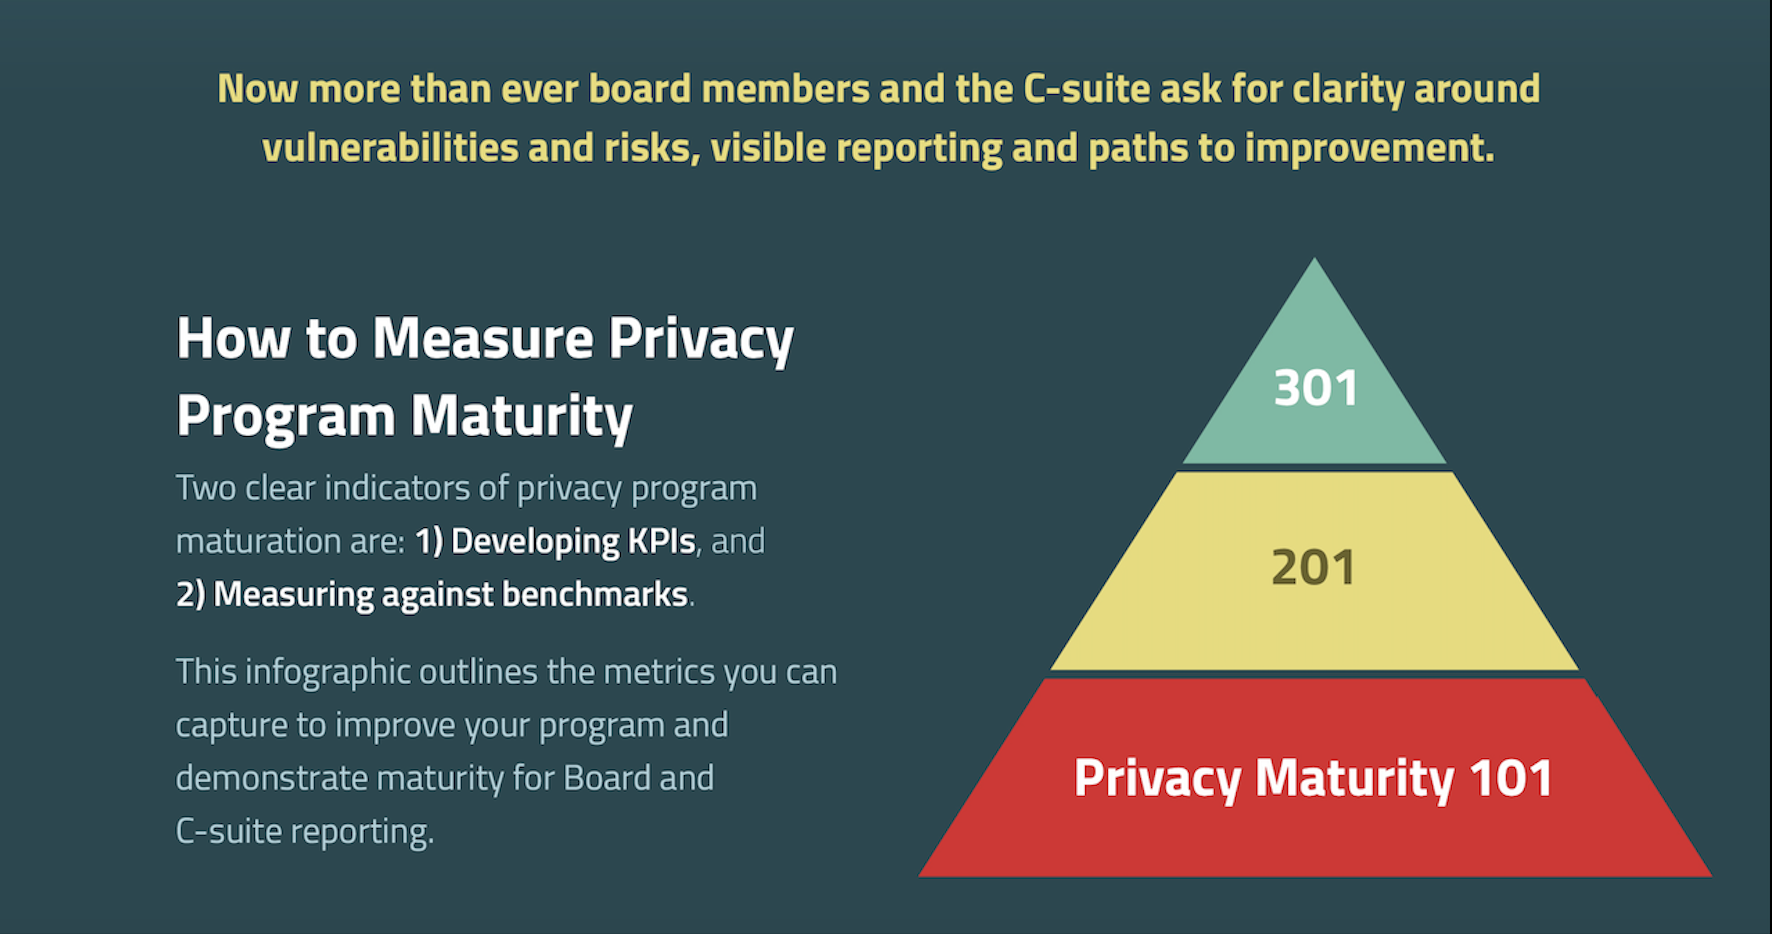
Benchmarking: The Key to Improving Your Privacy Program
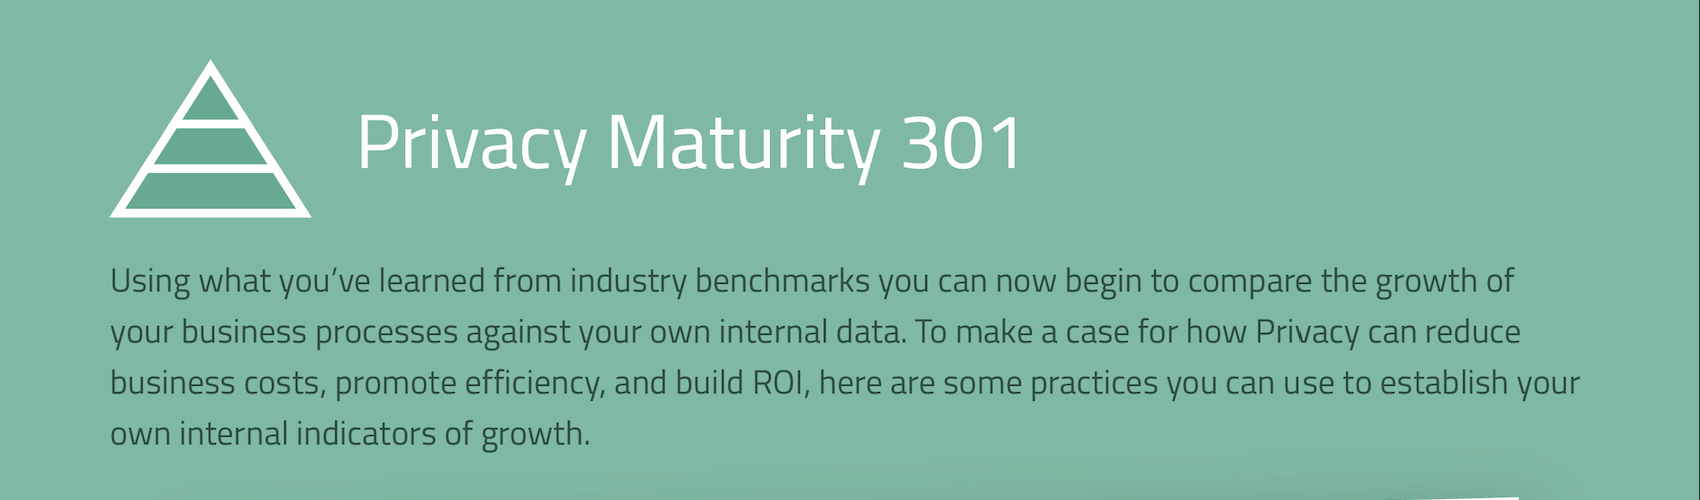
Mature privacy programs are critical to mitigating risk. Taking inventory and measuring against industry benchmarks is a clear indicator of your privacy program’s maturation.
Benchmarking helps gauge how well your privacy programs are doing and helps you better understand where to apply resources or examine your operations. We have compiled a maturation program worksheet outlining privacy KPIs for the insurance industry. Download the guide for a list of actionable KPIs to start tracking today.
You can analyze your organizational performance alongside the benchmarks available in The 2021 Privacy Incident Benchmark Report. For example, if you’re suffering from a rash of internal incidents, perhaps you need to up your training budget or improve your preventative controls. A few of our insurance industry benchmarking findings may surprise you:
- Only 3.81% of privacy incidents in insurance are actually notifiable incidents (when properly risk assessed).
- It took an average of 42 hours from when a privacy incident occurred to when it was discovered, up from 17 hours in 2018 — but half the time of the financial industry, which was 86.3 hours.
Leverage benchmarks for reporting today >>
Download the Insurance Industry Privacy Infographic
Making the Case for Increased Funding, Resources, Awareness
How can your organization garner increased funding and resources, and generate more awareness around your privacy programs? You need detailed proof, reports, and actionable KPIs. Here are specific metrics:
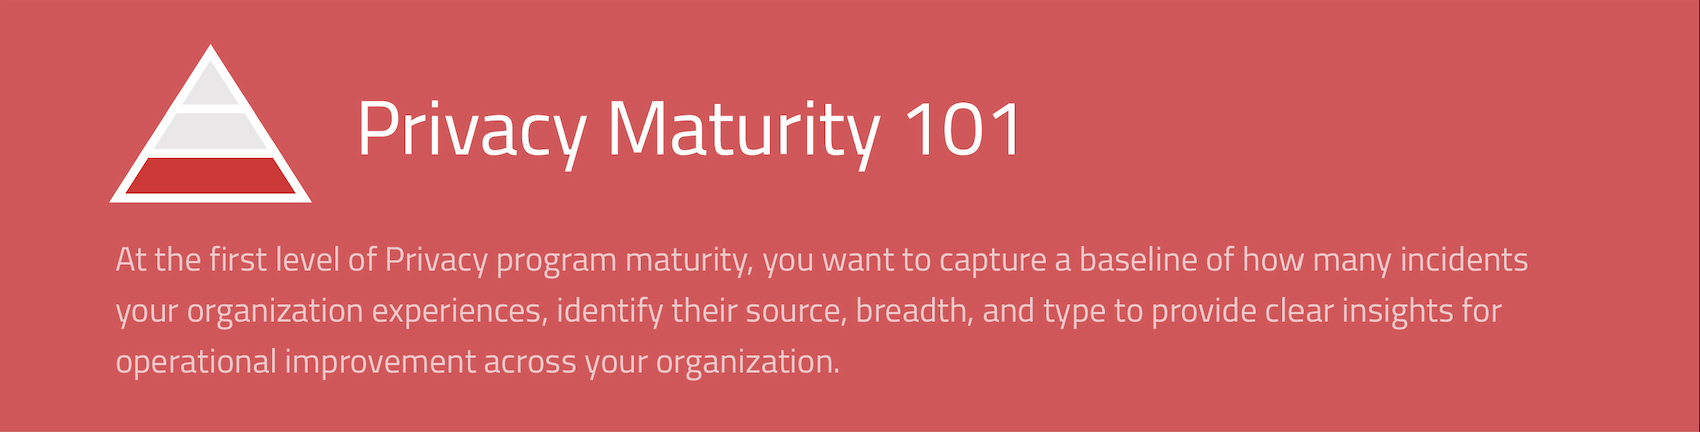
- The average number of incidents. This is your total number of incidents logged.
- The number of incidents by cause (malicious, non-malicious, unintentional). In the insurance industry, the vast majority of incidents in 2020 were unintentional, at 97.36%, with only 1.77% being malicious. For the latest insights about how you stack up across your industry and others, download the 2021 Privacy Incident Benchmark Report.
- The number of breaches. A fact that may surprise you: 96.19% of data breaches in the insurance industry were not notifiable in 2020, compared to only 3.81% that were. Notification is not required for every privacy incident. Many organizations turn to RadarFirst’s Radar, intelligent incident response management software, with a built-in Breach Guidance EngineTM, to ensure you make smart and accurate notification decisions.
- The average number of affected individuals per incident. These are the buckets of individuals that are affected by a privacy incident, multiplied by the percentage of incidents that fall within the buckets. Radar metadata indicates that in the insurance space, 86.73% of privacy incidents affected only one person, with 1.2% affecting 100 or more individuals.
- Incidents by type (paper, electronic, verbal/visual). The number of electronic-based privacy incidents (63.75%) in the insurance industry in 2020 is roughly double that of paper-based privacy incidents (33.76%), based on aggregated statistics from our intelligent response management platform.
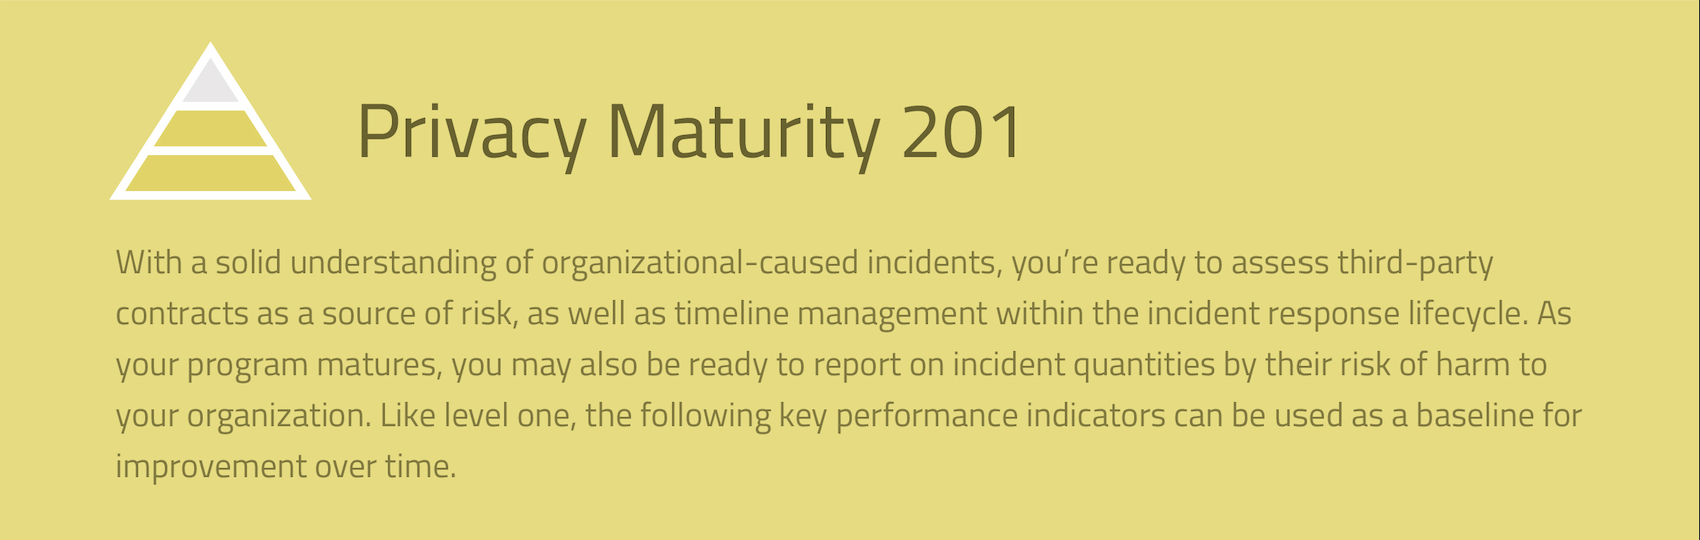 Percentage of incidents caused by third parties. Our findings show that based on assessed incidents in the insurance industry, 4.14% of internally-based incidents were breaches and 2.76% of externally-based incidents were risk assessed as notifiable breaches.
- Timeline from detection to risk assessment. In the insurance industry, it took an average of 258.9 hours in 2020 from the time an incident was discovered to assessment.
- Timeline from risk assessment to notification. It took insurance organizations an average of 188.5 hours from the time of the incident assessment to the first notification, based on our findings.
- Risk of harm. In 2020, 80.4% of incidents in the insurance sector were considered low risk, with 11.2% considered medium risk, and 7.37% of incidents considered high risk, according to RadarFirst’s incident response management software, Radar, with built-in risk assessment functionality.
- Your Board wants the metrics. What if it were easy to gather data and metrics for your Board reports? Let’s look at our findings:
- From occurrence of an incident to discovery, it took insurance organizations an average of 42 hours
- From discovery to assessment, took an average of 258.9 hours
- From the assessment to notification, took an average of 188.5 hours
Download the benchmarking infographic to learn how to take your privacy program to the next stage.
These numbers are based on Radar user metadata from 2020; a best practice is to do a check-in annually.
For actionable privacy benchmarking results to share with your stakeholders, check out the Insurance Privacy Maturity Infographic. Here’s to reducing risks and improving incident response overall.