
- A guide to privacy benchmarking for C-suite
- Actionable KPIs to improve incident response
- Free fill-in-the-blank benchmarking infographic
Read more below.
Benchmark and Improve Incident Response Planning
 Credit card numbers, bank account information, Social Security numbers — nearly every transaction, every swipe, and every purchase can potentially expose sensitive financial information. Organizations that provide financial services are under incredible scrutiny when it comes to protecting sensitive financial information and maintaining data privacy and security compliance. They face particularly strict data security regulations, each with enforceable and sometimes severe penalties.
The stakes are high, with the average data breach costing $3.86 million in 2020, according to a new report from IBM and the Ponemon Institute. When a financial organization experiences a privacy incident, all eyes are on you for incident response — including the C-Suite. To make reporting and privacy program improvement easy and documented, we’ve compiled a maturation program of privacy KPIs for financial services companies.
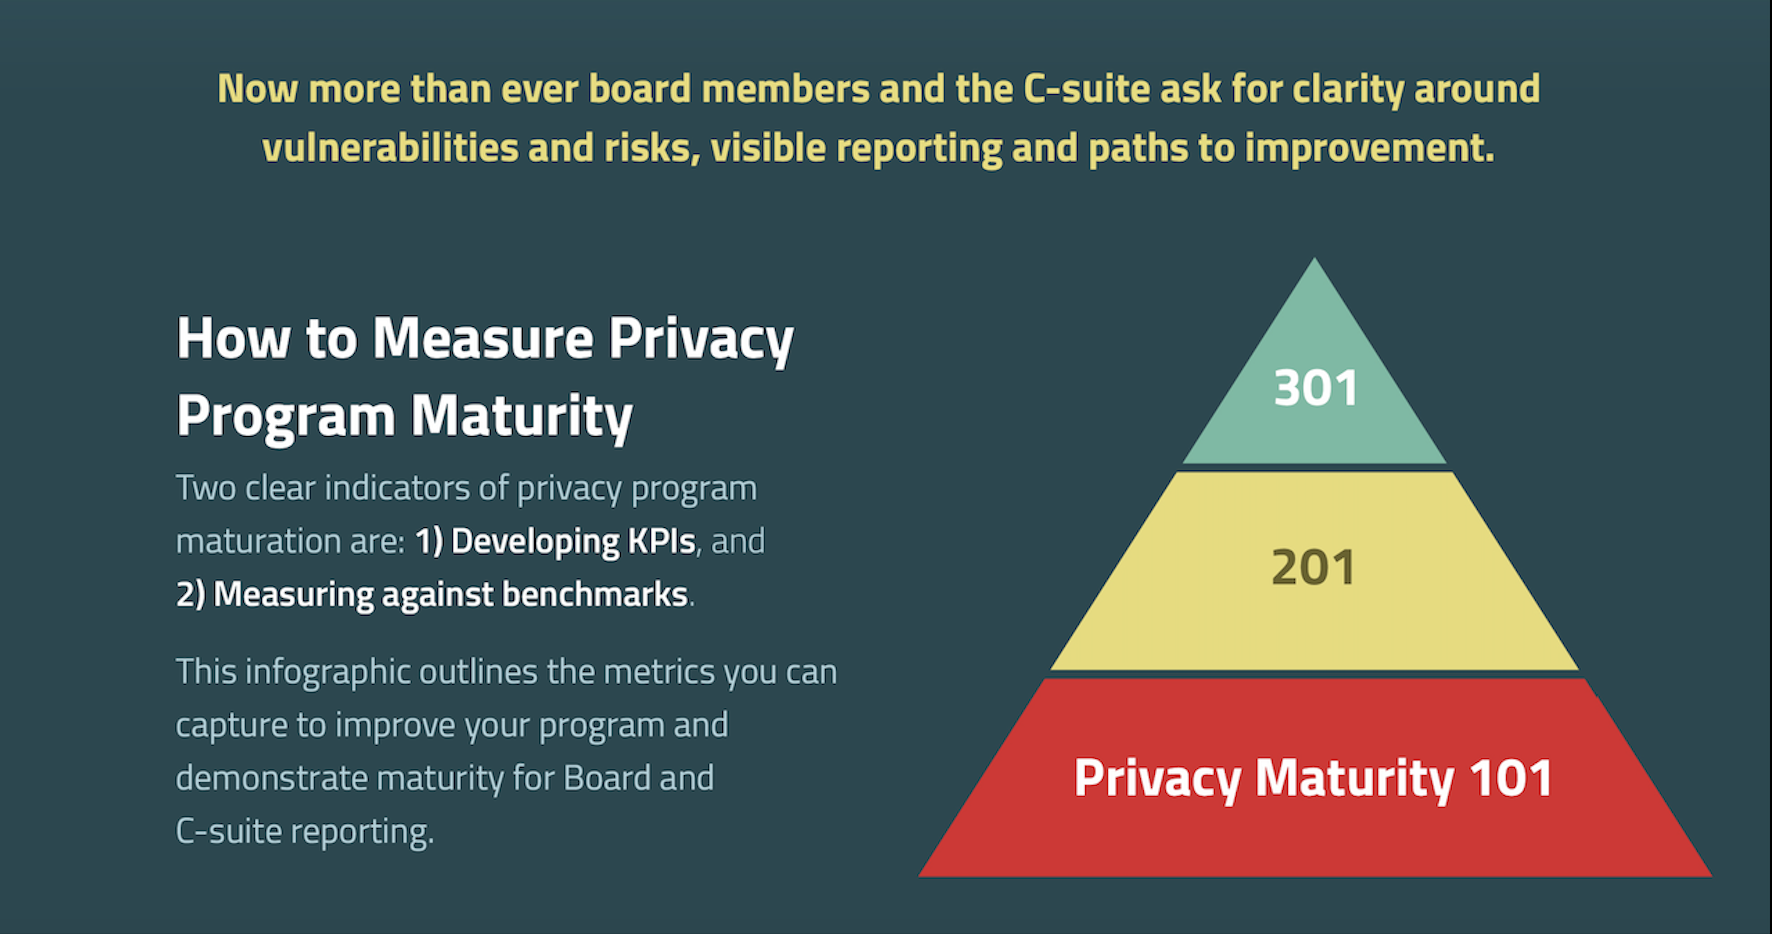
Financial organizations’ board members and C-Suite are requesting — maybe demanding — clear, visible reporting and paths to improvement. In The 2021 Privacy Incident Benchmark Report, we outlined how organizations can make the case for increased funding, resources, and awareness around privacy programs, as well as how to present detailed proof to stakeholders.
In all industries, taking inventory and measuring against industry benchmarks is a clear indicator of your privacy program’s maturation. In fact, 90% of organizations report privacy metrics to the C-Suite and Boards.
How Privacy Benchmarks Can Improve Incident Response
The 2021 Privacy Incident Benchmark Report highlights the latest insights to illustrate the value of a data-driven approach to privacy. How does your organization stack up?
Leverage benchmarks for reporting today >>
Download the Financial Services Privacy Infographic
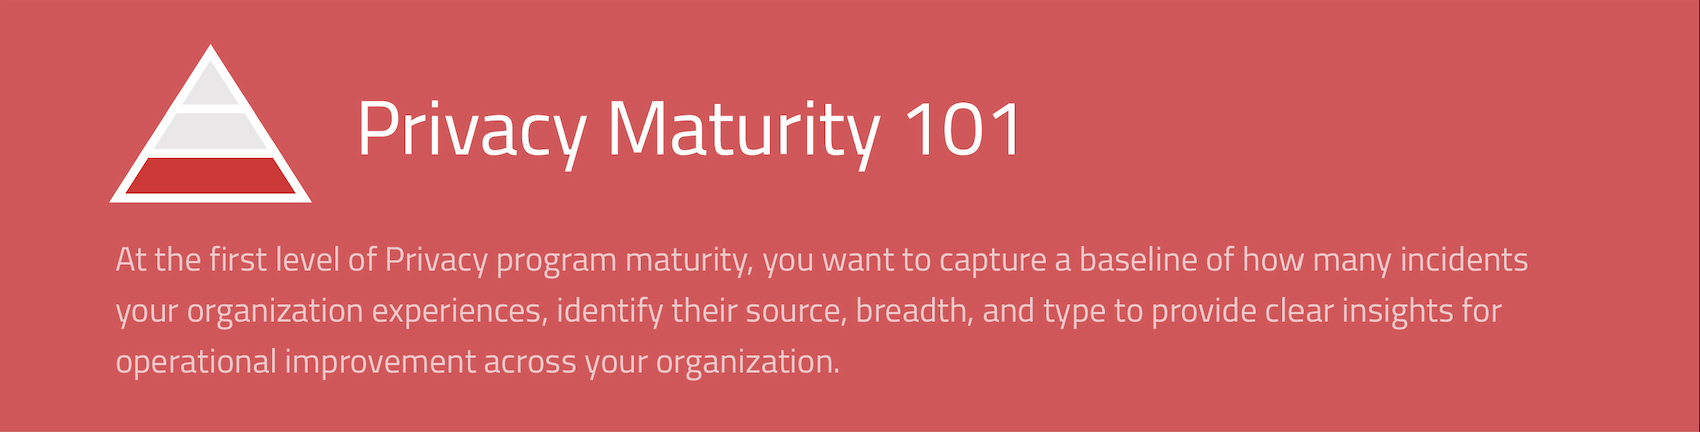
- The average number of incidents. This is your total number of incidents logged.
- The number of incidents by cause (malicious, non-malicious, unintentional). In the financial industry, the vast majority of incidents in 2020 were unintentional, at 95.56%, with only 1.53% being malicious. For the latest insights about how you stack up in the industry, download the 2021 Privacy Incident Benchmark Report.
- The number of breaches. You may be surprised to hear that 95.66% of data breaches in the financial industry were not notifiable in 2020, compared to only 4.34% that were notifiable. Many people think that notification is required for every incident. That’s not the case. RadarFirst’s Radar has a built-in Breach Guidance EngineTM to ensure you make accurate notification decisions.
- The average number of affected individuals per incident. These are the buckets of individuals that are affected by a privacy incident, multiplied by the percentage of incidents that fall within the buckets. Radar metadata indicates that 84.7% of incidents affected only one person, with 1.28% affecting 100 or more individuals.
- Incidents by type (paper, electronic, verbal/visual). The number of electronic-based privacy incidents (64.05%) in the financial industry in 2020 is more than double of paper-based privacy incidents (30.05%), based on aggregated statistics from our intelligent response management platform.
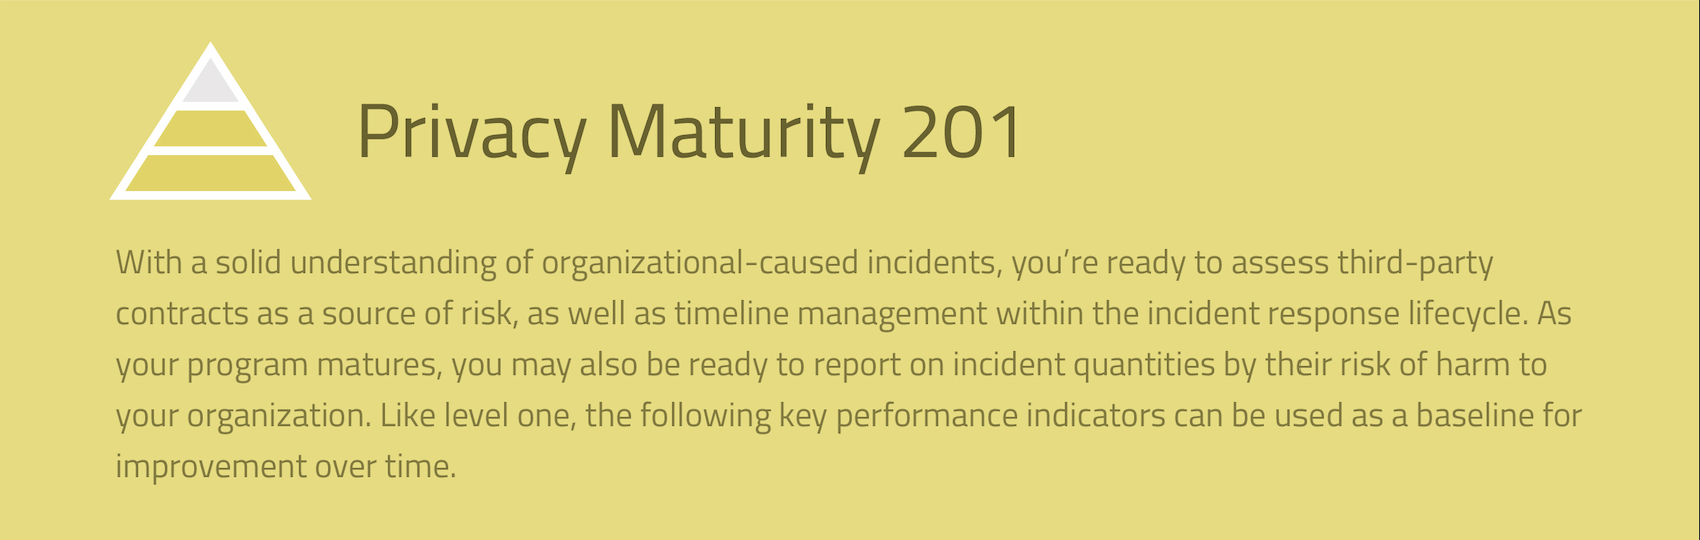
- Percentage of incidents caused by third parties. Our findings show that based on assessed incidents in the financial industry, of internally-based incidents, 5.15% were breaches and of externally-based incidents, 1.97% were risk assessed as notifiable breaches among financial services organizations.
- Timeline from detection to risk assessment. In the financial industry, it took an average of 186.2 hours in 2020 from the time of the incident discovery to assessment.
- Timeline from risk assessment to notification. It took financial organizations an average of 286.9 hours from the time of the incident assessment to the first notification, based on our findings.
- Risk of harm. In 2020, 79% of incidents in the financial sector were considered low risk, with 10.52% considered medium risk, and 8.21% of incidents considered high risk, according to RadarFirst’s incident response management software, Radar, with built-in risk assessment functionality.
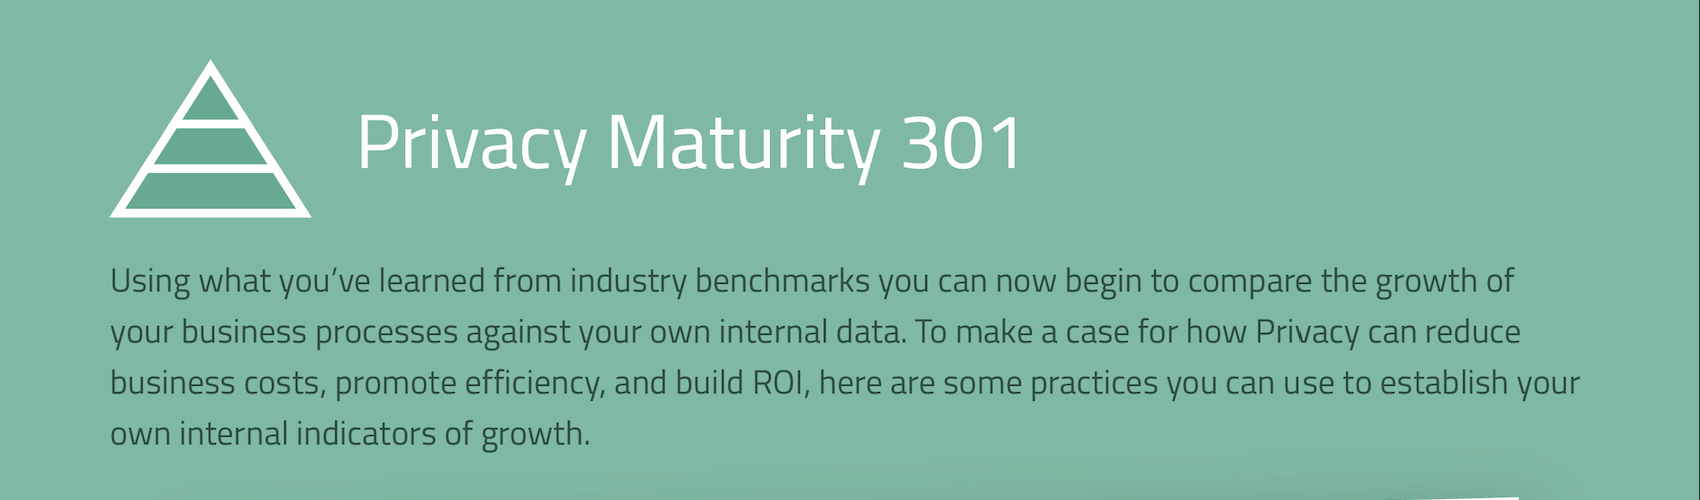
- Your Board wants the metrics. Imagine if you could easily gather metrics that outline your incident response timelines. Again, we look at our findings: from occurrence of an incident to discovery, it took financial organizations an average of 86.3 hours; from discovery to assessment, it took 186.2 hours; and from the assessment to notification, it took 286.9 hours. These numbers are based on analytics from 2020; it’s a good idea to do a check-in annually at the minimum.
Download the benchmarking infographic to learn how to take your privacy program to the next stage.
The Need for Mature Privacy Programs is Paramount
As privacy regulations expand in both definition and scope, protecting financial information becomes an increasingly complex challenge and so is the need to have clarity around organizational vulnerabilities and risks. The ever-evolving landscape of global data breach notification laws can be daunting.
To help, check out Breach Law Radar, a free library of hundreds of global privacy laws, rules, and regulations for you to stay current on existing and proposed legislation. With interactive maps to quickly identify notification laws that pertain to every U.S. state and data breach reporting requirements, users can learn if notification is even required. If it is, all of the information is easily accessible as to who, when, and how.
For actionable privacy benchmarking results to share with your stakeholders, check out the Financial Services Privacy Maturity Infographic for a better idea of internal trends that will help you come up with data and a plan — and hopefully more resources and funding — to reduce risks in your organization.